Supervisor cluster running out of disk space in /dev/root

This was a good catch by Broadcom support! I had logged a support request related to the vSpherelet (or Kubelet) in my customer’s Supervisor cluster. While we were troubleshooting that, it was noted that the /dev/root filesystem in the Supervisor control-plane nodes was running nearly full.
I can’t give you the full resolution as it should 100% be managed in tandem with Broadcom support. Getting it wrong could cause a lot of pain!
I won’t go into the vSpherelet issue, but while we were working it out, the support engineer noticed that there was very little free space in the /dev/root filesystem on the Supervisor control-plane nodes. Apparently this can happen if the Supervisor was deployed under vSphere 7 and now runs under vSphere 8. Strangely, that’s not the case for my homelab’s Supervisor, which has the same issue but has only ever been deployed under vSphere 8.
To work out if you have an issue with disk space in the Supervisor, you need to SSH into the three control-plane nodes. This comes with a massive health warning though. You can really break things if you’re not careful and possibly invalidate your support. Which is why I’m not reproducing everything that we did. For instructions on obtaining the password for the control-plane VMs, see Broadcom’s KB article 323407.
Armed with the password, you can SSH in and use the following command to check the disk space:
df -khThe entry for /dev/root is usually at the top. As you can see below, this particular Supervisor node is using 98% of the available disk space!
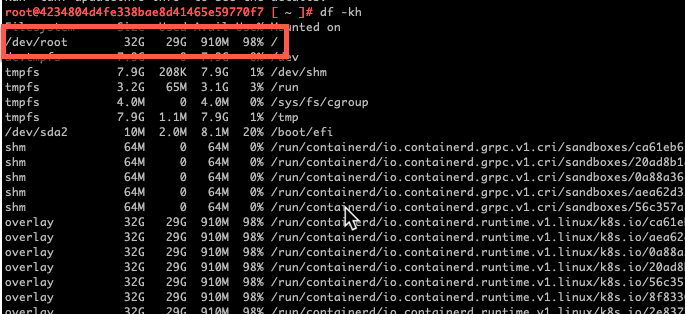
The other two control-plane nodes had usage figures of 63% and 100%! I was told that 40-50% is normal and healthy. Luckily that 100% figure in my homelab is rounded up and there was still 231Mb free! Etcd does not like running out of disk space though so something had to be done!!
I’m not clear on exactly what causes the disk to fill up like this. However, there are some temporary actions that you can take to relieve the pressure a bit. For the full fix, you’ll have to log a support request as I don’t want the responsibility of b0rking anyone else’s environment!
Firstly, let’s check out the health of etcd. The following three commands output some useful information:
etcdctl --cluster=true endpoint health -w table

etcdctl member list -w table

etcdctl --cluster=true endpoint status -w table
In the image below, you can see the output from my homelab’s Supervisor cluster.
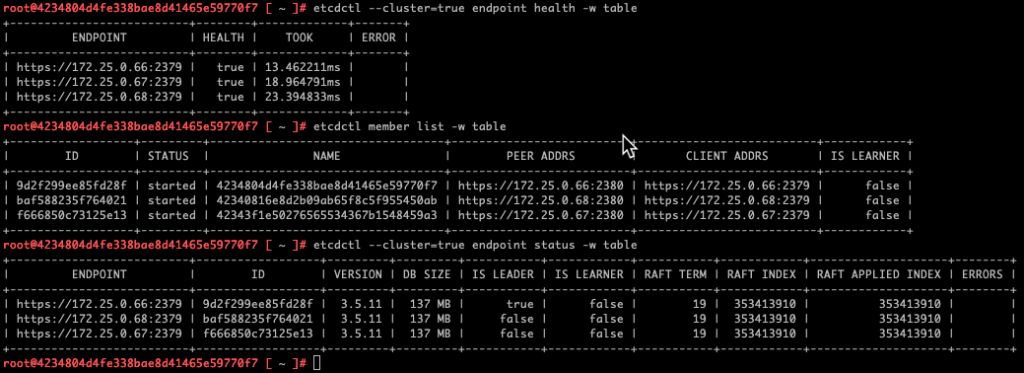
The output is good. Nothing untoward there and you even can see which node is the master in the third table.
Now, to clear some disk space, you can run the following commands on each of the control-plane nodes (type carefully, it’s not my fault if you get it wrong):
journalctl --vacuum-time=2d

cd /var/log/vmware/audit

rm *log.gz
Below you’ll see the output from one of my homelab’s Supervisor nodes. I also ran df -kh again afterwards.
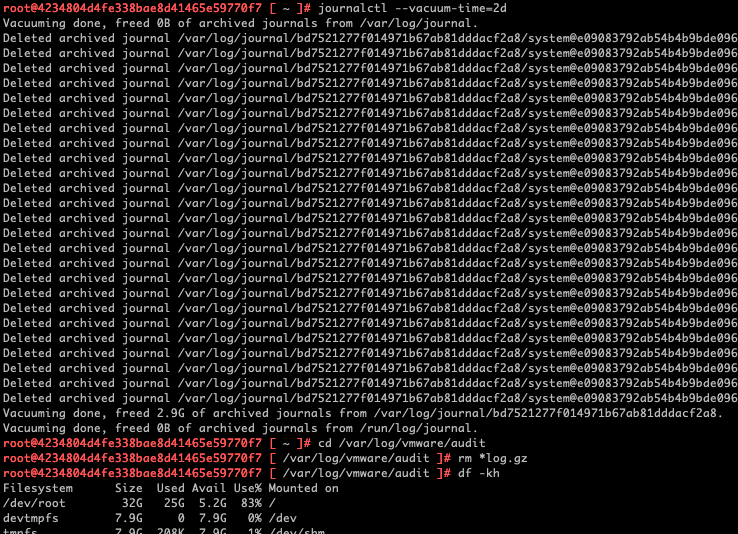
As I mentioned before, it’s temporary relief only. I recovered a little over 10% back. On two of the nodes though, that was critical.
So, how is this fixed more permanently? Well, there’s a script to be run and a process to be followed. You’ll need to get both from Boardcom support if this issue affects you. You’ll also need about an hour of time as it involves replacing each Supervisor node in turn and waiting for the new instances to join the cluster.
The net result though, the disk usage for /dev/root on my Supervisor control-plane nodes looks much healthier:
/dev/root 32G 9.0G 21G 31% /

/dev/root 32G 8.7G 22G 30% /

/dev/root 32G 8.8G 21G 30% /
And apparently it should now stay that way!
Photo by YoonJae Baik.


Related Posts