Setting the scripting log level in VMware Aria Orchestrator using the CLI

It’s been some time since I’ve had to use VMware Aria Orchestrator. Until the acquisition of VMware by Broadcom I was the Technical Marketing Architect for it, so you could say that I know it well!
I had cause to go back to it this week for a project that I’m working on. As I was working in a newly deployed environment, I was keen to check the scripting debug logs to troubleshoot a minor issue that I was experiencing. However, it’s easy to forget that by default that Orchestrator doesn’t capture debug-level messages by default. You have to enable it.
Default Scripting Log Settings

Although you can use the selector when viewing Workflow executions to determine the level of log messages displayed, above you can see it set to DEBUG, the log viewer pane can only show logs that have been captured. By default, this doesn’t include debug messages.
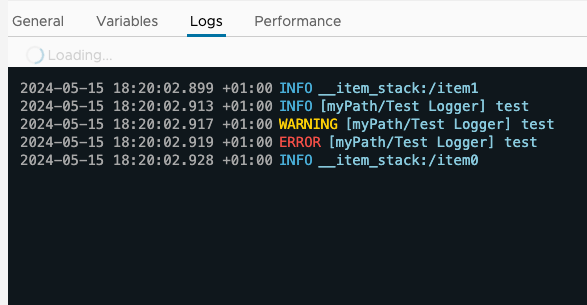
With the selector set to DEBUG as above, if you were to log one of every common type of message (INFO / WARN / ERROR / DEBUG), you would only see three of the four as demonstrated in the screenshot below.

In all, there are 8 different logging levels that can be set. In order they are:
- ALL
- TRACE
- DEBUG
- INFO – (the default level)
- WARN
- ERROR
- FATAL
- OFF
Each level includes the levels below it (except OFF, which logs nothing) so by default we only get INFO, WARN, ERROR, and FATAL. So we need to change the level.
Control Center is being Deprecated
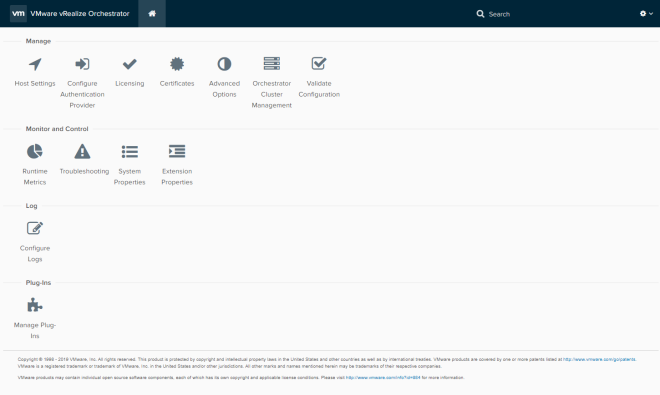
A recent change to Orchestrator is that more of the Control Center UI is being, or has been, reproduced elsewhere (depending on the version, see the Release Notes). Typically this is where you would have configured such a setting. Instead there is now a CLI that does the job.

Why a CLI?
The two key reasons why Control Center features are being replicated in a CLI are:
- Without building an API for Control Center, automating the configuration of Orchestrator is easiest using a CLI.
- It wasn’t a resource hog, but the Control Center still used some resources. Without it, that’s one fewer containers required. I expect it will be deprecated in the future.
Let’s face it, the settings exposed by Control Center weren’t things that you’d expect to change that often anyway!
Configure Scripting Log Settings
Enough about why, let’s turn our attention to how. The CLI is accessed either via the VM appliance’s console, or the SSH console. I’ll assume that you know how to do that.
Show Current Log Level
Let’s see the current log level first:
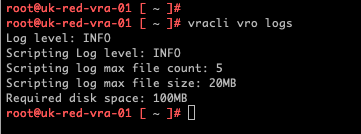
vracli vro logsThis command will take a few moments to execute but will return the current log settings, which will look like this:

On the 2nd line of the output you can clearly see that the current level is INFO. So let’s change it…
Set Scripting Log Level
To set / change the Scripting Log level, we just need to add a couple of extra arguments onto the command above (this command restarts the Orchestrator service):
vracli vro logs configure -sl DEBUGThe command will take a few seconds to return because Orchestrator gets restarted. But you’ll see a confirmation when it completes and you can use the first command to verify the setting.

Next time a debug message is logged you’ll then be able to see it in the log viewer pane in the Orchestrator UI.
Update 16/05/2024: Added some clarification around the Orchestrator Control Center. I don’t know for sure that it’s being deprecated, but the signs point to it.
Photo by Atlas Kadrów.


Related Posts